How we scaled real-time data to thousands of people
This is the first part of my first series called 'Real-Time Stats on BLAST.tv.' In this series, I wanted to show and explain how we at BLAST are and what technical/engineering challenges that come with trying to build new functionalities for a large user base.
The purpose of Real Time Statistics
I first wanted to discuss our 'Real-Time Statistics' on our platform, BLAST.tv. The reason we wanted real-time statistics on BLAST.tv was that it was one of the most requested features by our users, and we also aimed to enhance the way our viewers experience esports online.
We believed that bringing live statistics closer to the end-user would provide them with more insights into the game while they are watching the livestream. It would also allow the users to discuss the statistics in the chat window we have on the website.
The history behind Real Time Statistics on BLAST.tv
It all begins with our team wanting implement real-time statistics for Counter-Strike (the game). These statistics would display in-depth information for the given match we are showcasing on BLAST.tv, similar to how the website HLTV does it. Counter-Strike has functionality that allows it to send game events occurring on the game server to a specific HTTP endpoint in the form of log lines.
Example of a log line: 01/01/1970 - 00:00:00.000 - MatchStatus: Score: 0:0 on map "de_overpass" RoundsPlayed: 0
We ended up creating a relatively simple log processor that processed the log lines and inserted the data into a relational database (PostgreSQL). The data was split into entity events (match events) and player events (kills, deaths, assists, etc.). We stored the 'loggedAt' timestamp as well, so we could list the events in the order they were sent. The splitting of events allows us to query specific data depending on what we need for the product.
The design
Our designers created a design for live statistics with two different views: a simple overview and a more in-depth one. The simple view provides users with key statistics for each player, along with the current score on the map and information about the leading team. The two bars on either side indicate the number of maps each team has won. Most Counter-Strike matches are played in a Best of 3 (BO3) format, so winning 2 maps is required to win the match.

The detailed view shows more in-depth statistics for each player. When the user expands the left sidebar, they are given the option to choose between the two teams. After the user has picked one of the two teams, they need to select a specific player for that team. Once the player is selected, they can view in-depth statistics such as Average Damage per Round (ADR) or headshot percentage, and so on.

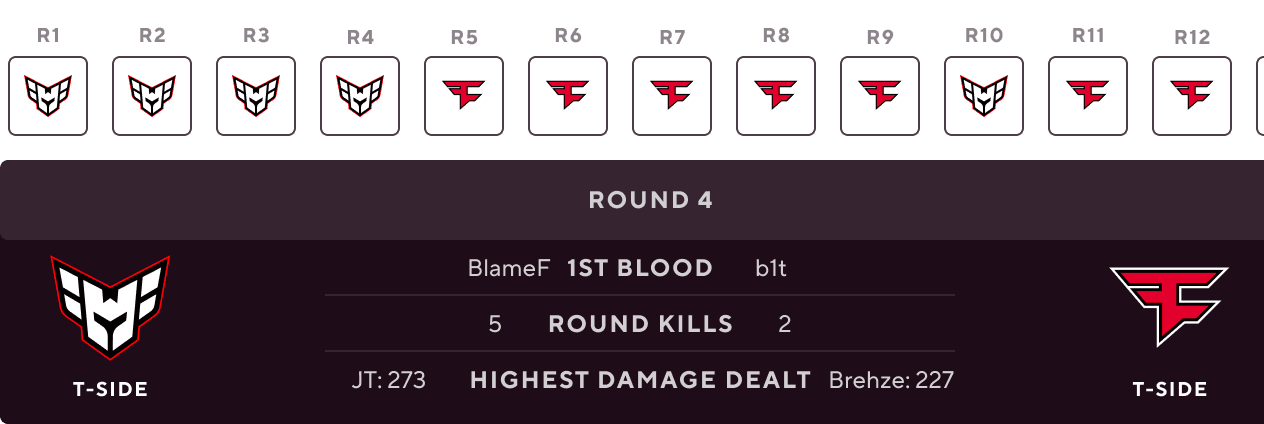
When the detailed view is expanded, the bottom stats bar would also expand to reveal the round progression over time, showing which team won each round. The user would be able to click into a specific round, and see detailed statistics about which player got the first blood, the number of kills each team achieved in that specific round, as well as who dealt the most damage.
The problems with scaling
As you can see by the designs, we needed to provide a lot of detailed information/data about the running match, and that’s the reason why this became one of our biggest and most complicated systems we have to date.
I have chosen to split the problems into separate articles, making it easier to understand the various challenges we have encountered while scaling this product to thousands of users. I have tried to focus the articles around the scaling issues we have been through instead of the actual logic that goes on behind the scenes.
Next article, would you be able to read what challenges we faced with using serverless infrastructure to build out this functionality, and how serverless isn’t always the way forward for having well-performing infrastructure.
I’m also discussing different strategies we used to deliver real-time data to the end user and how we scaled that. I will dive deeper into how we scaled the data to thousands of users using cache in different ways. API caching isn’t always the way to go, and I will argue why we chose to move away from using it to use static files instead.
Thank you for taking the time to read my article. Have a great day! ☀️